Zoom-Triggered Actions in Leaflet and Shiny

sf leaflet shiny ggplot2 tigris tidycensus geospatial

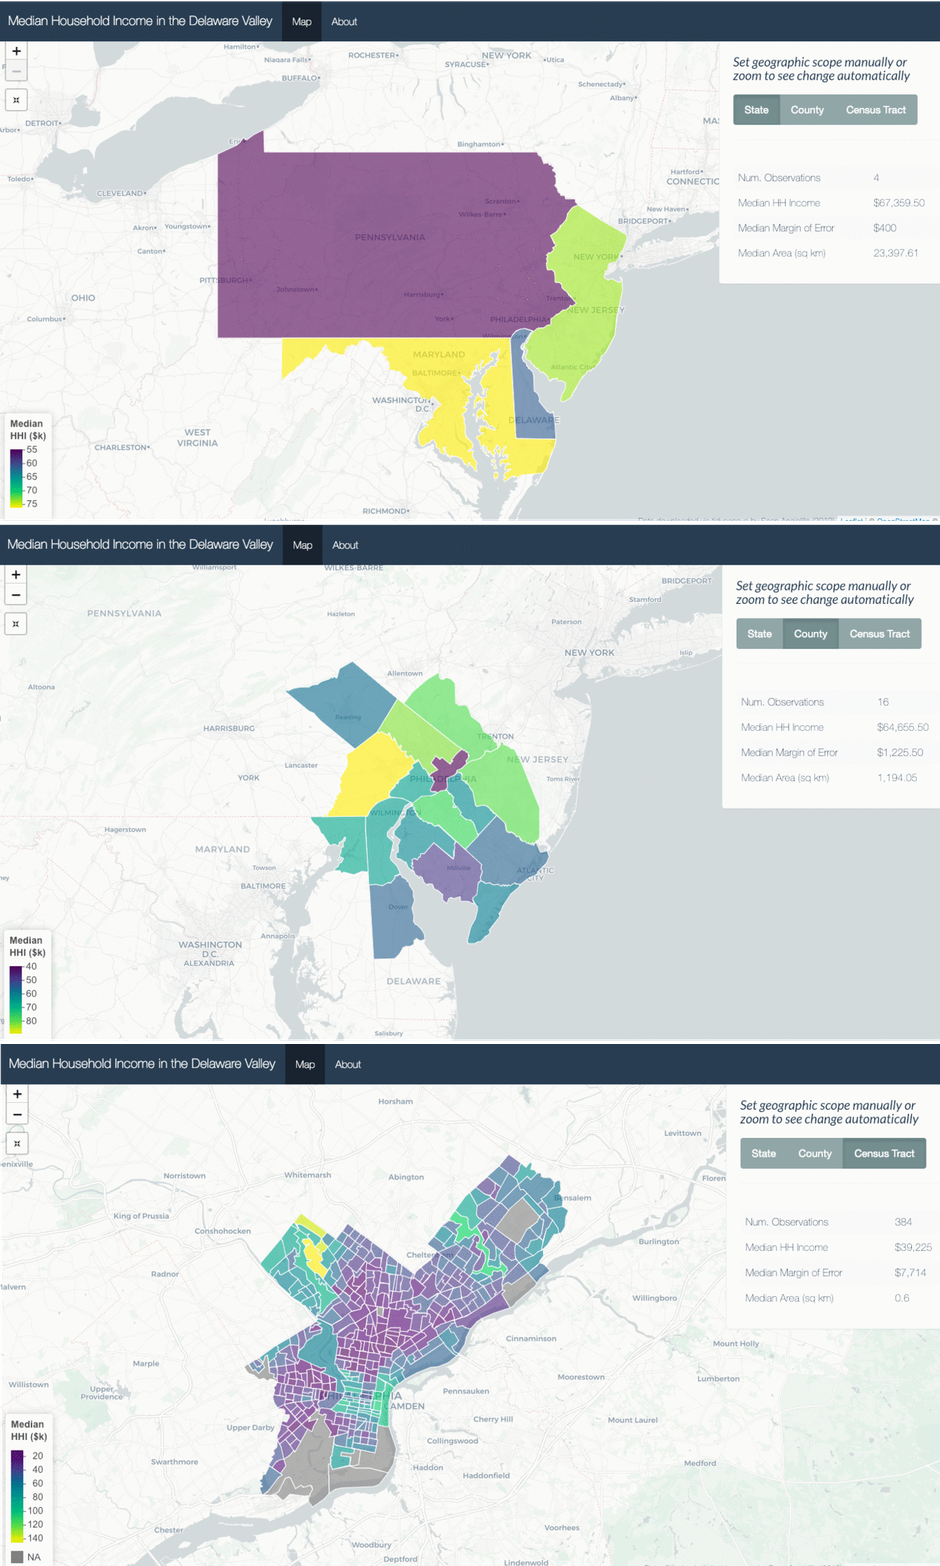
Explore median household income data in the Delaware Valley at various levels of scope

This is a simple project demonstrating how to trigger actions in Shiny-Leaflet projects using the zoom level. Given a zoom level, the map displays the corresponding state, county or census tract shapes. Find the app at the link below.

https://seanangio.shinyapps.io/dv_income/
You can also find its Github repo.

Reuse

Text and figures are licensed under Creative Commons Attribution CC BY-NC 4.0. The figures that have been reused from other sources don't fall under this license and can be recognized by a note in their caption: "Figure from ...".